And Roseville is in which county?
(Ramsey)
| Twin Cities Carry Forum Archive http://twincitiescarry.com/forum/ |
|
| BCA Report Out http://twincitiescarry.com/forum/viewtopic.php?f=2&t=11975 |
Page 3 of 3 |
| Author: | DeanC [ Wed Mar 04, 2009 7:45 pm ] |
| Post subject: | |
And Roseville is in which county? (Ramsey) |
|
| Author: | joelr [ Wed Mar 04, 2009 7:55 pm ] |
| Post subject: | |
DeanC wrote: And Roseville is in which county? (Ramsey) |
|
| Author: | 12smile [ Thu Mar 05, 2009 4:49 am ] |
| Post subject: | |
The age and sex of permit holders was given but ONLY by zip code...I'd like to get an idea of the age of permit holders....In Texas it's roughly true that 50% of permit holders were over 40 and 40% were over 50. I'm assuming it's comparable in Minnesota.. Permit holders are OLD FAT WHITE GUYS True? or False? Stats are there how can I analyze them to get the answer? Is there a page I missed in the BCA report? |
|
| Author: | princewally [ Thu Mar 05, 2009 8:39 am ] |
| Post subject: | |
You have to special request the data in a spreadsheet. They've got the programming set up to do it. I know, because I nagged them for a month last year to get it. |
|
| Author: | Andrew Rothman [ Thu Mar 05, 2009 2:56 pm ] |
| Post subject: | |
...or do some tricky PDF extraction. For permits issued in the time period of this report: Code: Male 18619 90% Female 2171 10% 21-29 2765 13.30% 30-39 3278 15.77% 40-49 4432 21.32% 50-59 5269 25.34% 60-69 3820 18.37% 70-79 1106 5.32% 80-89 118 0.57% 90-99 2 0.01% Almost exactly half of the permits issued in this report were to ages 50 or greater, half to ages 49 or lower. 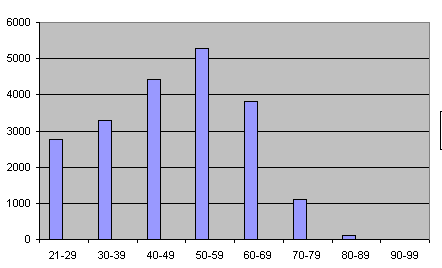
If anyone wants the cleaned, raw data to do their own analysis, it's here: http://www.madfi.org/post/2008_report_analysis.xls |
|
| Author: | Andrew Rothman [ Thu Mar 05, 2009 3:30 pm ] |
| Post subject: | |
For currently active permits, whenever issued: Code: total 58801 Male 52377 89% Female 6424 11% 21-29 6889 12% 30-39 9868 17% 40-49 12558 21% 50-59 14648 25% 60-69 10966 19% 70-79 3399 6% 80-89 454 1% 90-99 19 0% 100% Yes, there's a slight discrepancy in the totals. I don't know why. Overall, the age distribution is holding pretty steady. If anyone wants the cleaned, raw data to do their own analysis, it's here: http://www.madfi.org/post/2009_02_todate_analysis.xls |
|
| Author: | Timothy Nelson [ Thu Mar 05, 2009 5:00 pm ] |
| Post subject: | |
Thanks for the graphic and info, Andrew. |
|
| Author: | 12smile [ Fri Mar 06, 2009 4:03 am ] |
| Post subject: | |
The short answer is 90 / 10 male female 70% over 40 50% over 50 I would bet thats close for most states Thanks for the info |
|
| Page 3 of 3 | All times are UTC - 6 hours |
| Powered by phpBB © 2000, 2002, 2005, 2007 phpBB Group http://www.phpbb.com/ |
|